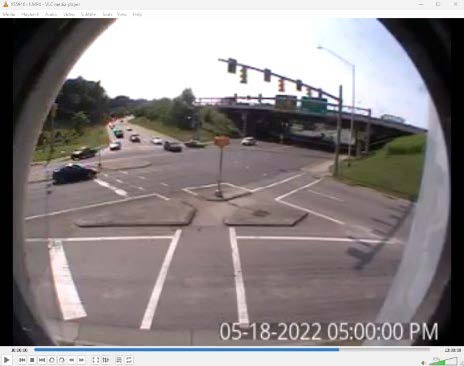
The 20-Flags method supplied through NCHRP Research Report 948 is a way to assess bicycle and pedestrian safety at intersections. These design flags and their thresholds were built from data ,expert input, and previous research; however the resultant outcomes in flags from using this method had not been compared to crash data to determine how well it predicted associated crash patterns. This project sought to understand corollary relationships between the flags and crashes by applying the method to 300 intersections of state roads in North Carolina and comparing the resultant red and yellow design flags to the historical crash data from 2010-2019 for each. The objective was to determine if crashes and flags generally trended in the same direction (i.e., do intersections with more flagged elements or more red flags result in higher numbers or rates of pedestrian or bicyclist crashes.) At a subset of 100 intersections, video camera footage was collected and processed to extract pedestrian crossing movement counts, bicyclist through and turning movement counts (TMCs), and motor vehicle (MV) TMCs. The 20-Flags method was re-applied using MV TMC volume for this subsample of sites to compare how the flags changed when observational volume was used in lieu of estimated proxy volumes. The pedestrian and bicycle counts were used to generate crash rates to compare with resultant flags, which was important given that sites with zero crashes may not necessarily mean they are safe sites. Analyzing the full 300-intersection set, six flags were present for at least one movement at almost every intersection, which could indicate a systemic safety concern or lack of safe pedestrian or bicyclist infrastructure at similar state owned sites. Given that red design flags indicate a safety concern while yellow flags relate more to comfort, and upon inspecting the correlations between red flags and crashes, the most frequently correlated flags to pedestrian crashes are 1 (motor vehicle right turns), 4 (crossing yield- or uncontrolled vehicle paths), and 13 (grade change) while those to bicyclist crashes are 11 (intersection driveways and side streets), and 16 (lane change across motor vehicle lane.) Summary variables, such as total number of red flags, almost always negatively correlated with crash variables, suggesting that summing the flags per intersection may be less effective in analyzing pedestrian and bicyclist safety concerns as inspecting each design flag raised individually.

